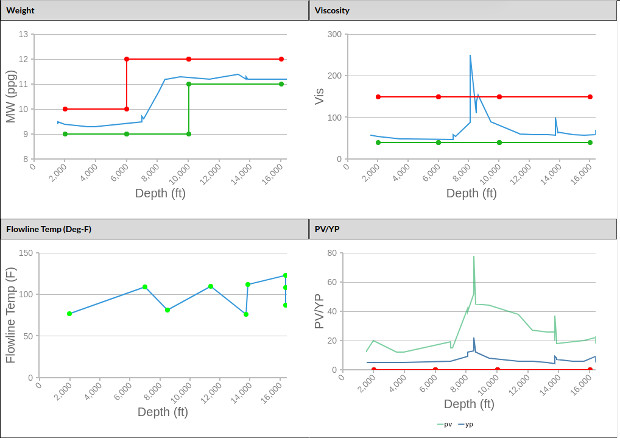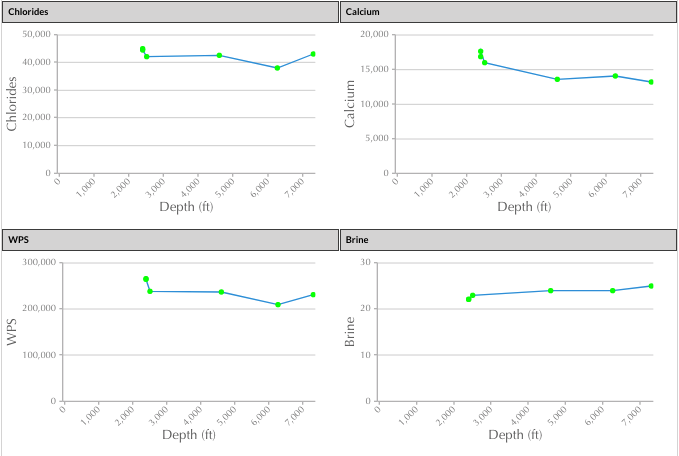

MudWorks mud software shows you how your well looks over time and depth.
What good is a mud reporting system without beautiful charts and graphs? We know that your data has to be meaningful to you and your clients. That’s why we have created colorful charts that can display your time and depth based data in a sensible and even beautiful way. Choose between depth on the x-axis or y-axis.
Our stock mud reports allow you to set limits and view data for mud weight, viscosity, flowline temperature, PV/YP, gel strengths, costs and much more. If that isn’t enough for your needs, our custom software packages can easily accommodate whatever data graphing needs you may have.
Want to know more? Request a demo today.

